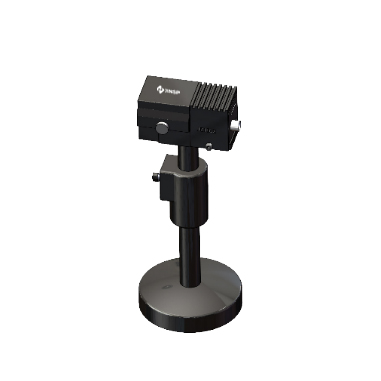
JB1023 Spot Beam Analyzer
- 400nm-1000nm (up to 300nm-1100nm) can measure the wavelength range
- Plug-in absorption energy attenuation
- 2.3MP, 1/1.2" CMOS industrial area scan camera
- 12bitAD digits, 70dB dynamic range
- 40dB signal-to-noise ratio, gain control 0~20dB
- 5.86μm*5.86μm cell size
- 11mm*7mm effective sensing area
- The minimum detection area is 30μm (5 pixels).
- Maximum frame rate 41fps@1920*1200
- 34μs-10s exposure time, support automatic, manual, one-button exposure
- Backgrounds can be captured and subtracted
- Three external I/Os and an external power supply with P7 connectors are provided
- Provides a pulse frame generated by the average light intensity to trigger threshold adjustment
-
Free combination and displacement of filters
- USB3.0 interface, power supply and transfer data, and compatible with USB2.0
- IP30 protection class
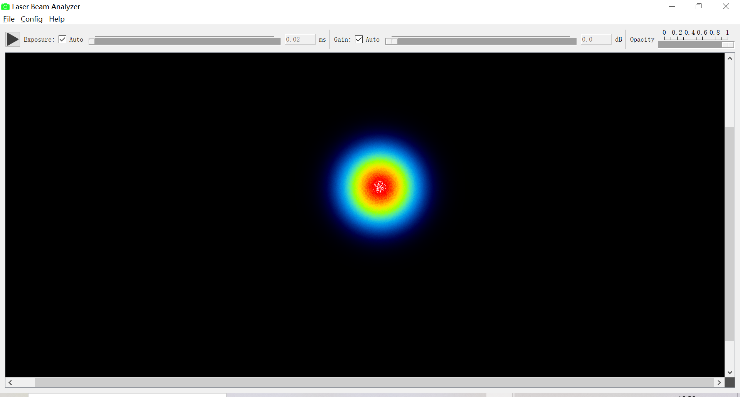
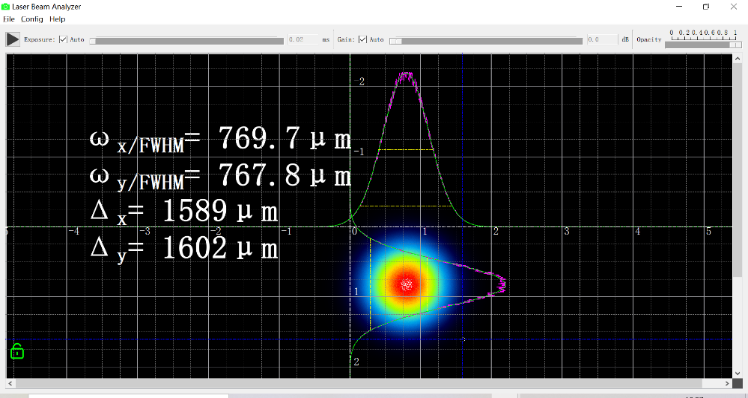
Spot shape and size in real time
It can display the shape of the spot and the orthogonal two-dimensional measurement parameters in real-time, perform Gaussian fitting, flat top fitting, and can draw two-dimensional beam maps in real-time.
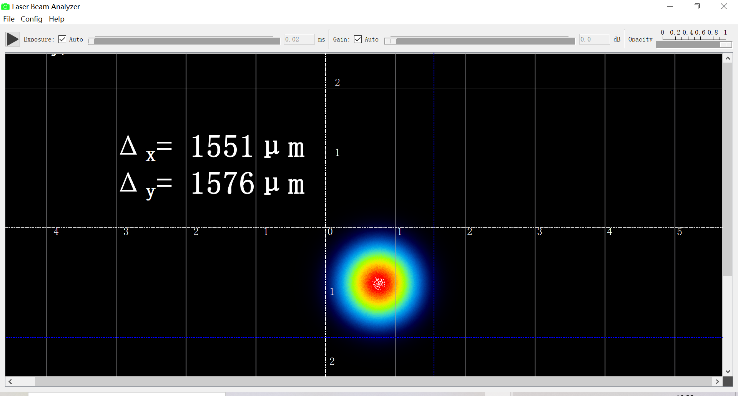
Spot position contrast
Detects beam position and monitors beam position, shape, size, and power. The new data can be compared to the recorded data.
Analysis and quality assurance
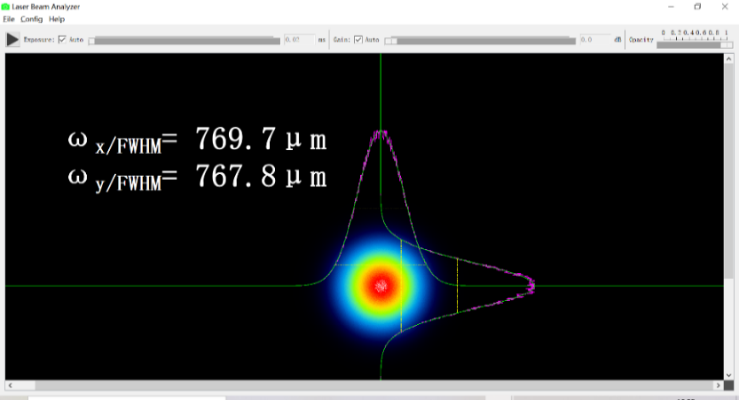
The system calculates the optimal fit for examining the spot. Calculates the major and minor axes of the fitted curve, as well as the direction of the major axis of the fitted curve. The measurement point can be customized by the user and the distance between two points on the image can be calculated.
Detailed statistics
The statistics screen lists information in tabular form and displays the actual measured values as well as MAX (maximum measured values), AVER (mean) and STD(standard deviation): centroid (H/V profile), several parameters that are critical for beam analysis, Beam peak (HIV waveform), correlation with Gaussian distribution (H/V distribution), power (mW).
Power detection (optional).
The beam power is displayed as a digital reading on the status bar. power
The calibration function allows the user to enter a "basic" power value. In subsequent images, the total intensity of all pixels will be proportional to this value.
Spot real-time 2D display
Software controls the electronic shutter and gain
Reporting Function - Spot Analysis and Results
Support binary format, JSON format data export
Log the data to a text file
Printing of text and pictures
Real-time snapshot file replay to complete the analysis of the results
Images can be captured, and the number of images is determined by the storage space of the hard disk
Reporting Function - Spot Analysis and Results
Multi-system operation (Windows 7/10).
|
Digital I/O port |
1 optocoupler isolated input, 1 optocoupler isolated output, 1 bidirectional configurable non-isolated |
|
Power supply |
USB powered or 12V DC externally powered |
|
power consumption |
2.52W@5VDC (USB powered) |
|
agreement |
USB3 Vision, GenlCam |
|
Dimensions |
78mm × 45mm × 38.5mm (without base). |
|
weight |
180g (without base). |
|
Base height |
Adjust the height to 15-25cm |
|
Filter housing bin |
1 standard (shelled) 1" filter and 4 shellless 1" filters can be placed |
|
Operating temperature |
0°c - 50°c |
|
Storage temperature |
-30°c - 70°c |