A spectrometer is a scientific instrument, used to analyze the spectrum of electromagnetic radiations, it can display a spectrum of radiations as a spectrograph representing the distribution of light intensity with respect to wavelength (y-axis is the intensity, x-axis is the wavelength/frequency of the light). The light is different separated into its constituent’s wavelengths inside the spectrometer by beam splitters, which are usually refractive prisms or diffraction gratings Fig. 1.
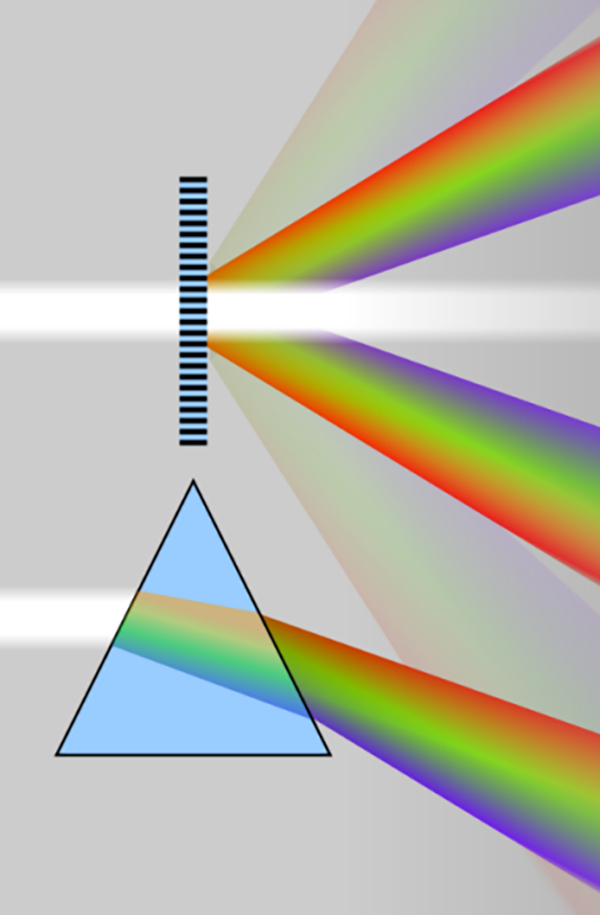
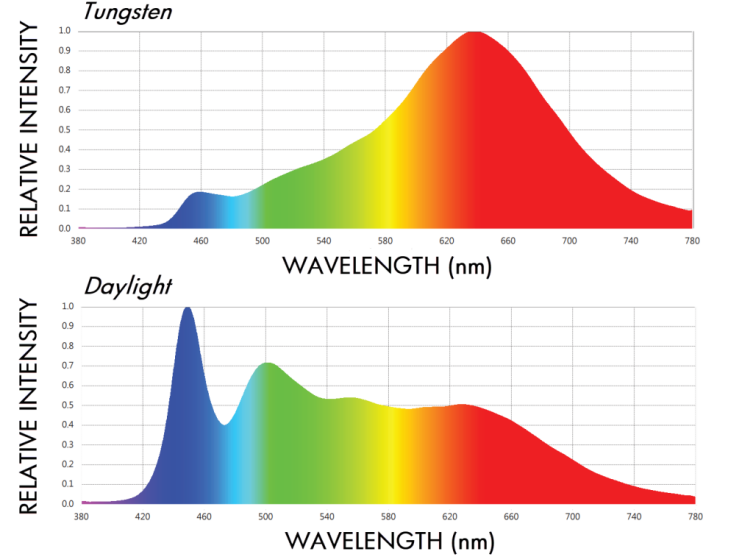
Fig. 1 Spectrum of light bulb and sunlight (left), beam splitting principle of grating and prism (right)
Spectrometers play an important role in measuring a broad range of optical radiation, whether by directly examining the emission spectrum of a light source or by analyzing the reflection, absorption, transmission, or scattering of light following its interaction with a material. After the light and matter interaction, the spectrum experience the change in a certain spectral range or a specific wavelength, and the properties of the substance can be qualitatively or quantitatively analyzed according to the change in the spectrum, such as the biological and chemical analysis of the composition and concentration of blood and unknown solutions, and the analysis of the molecule, atomic structure and elemental composition of materials Fig. 2.
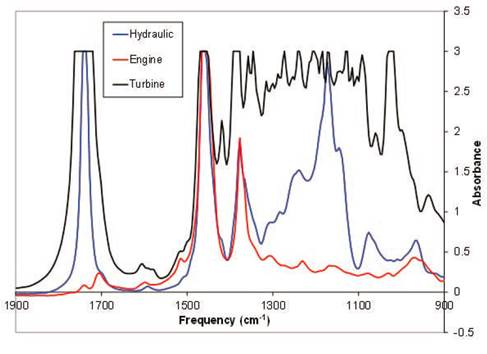
Fig. 2 Infrared absorption spectra of different types of oils
Originally invented for the study of physics, astronomy, chemistry, the spectrometer is now one of the most important instruments in many fields such as chemical engineering, materials analysis, astronomical science, medical diagnostics, and bio-sensing. In the 17th century, Isaac Newton able to splits the light into continuous colored band by passing a beam of white light through a prism and used word “Spectrum” for the first time to describe this results Fig. 3.
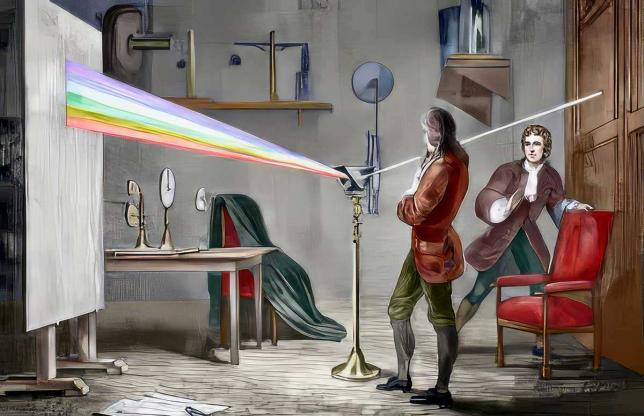
Fig. 3 Isaac Newton studies the sunlight spectrum with a prism.
At the beginning of the 19th century, the German scientist Joseph von Fraunhofer (Franchofer), combined with prisms, diffraction slits and telescopes, made a spectrometer with high precision and accuracy, which was used to analyze the spectrum of solar emissions Fig 4. He observed for the first time that spectrum of the sun's seven-color is not continuous, but has a number of dark lines (over 600 discrete lines) on it, knows as the famous "Frankenhofer line". He named the most distinct of these lines A, B, C…H and he counted some 574 lines between B and H which corresponds to the absorption of different elements on the solar spectrum Fig. 5. At the same time, Fraunhofer was also the first to use a diffraction grating to obtain line spectra and to calculate the wavelength of the spectral lines.
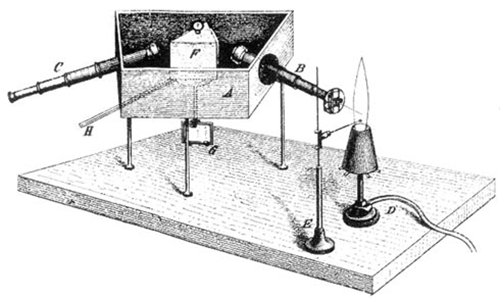
Fig. 4. An early spectrometer, viewed with the human
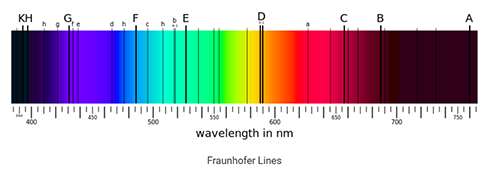
Fig. 5 Fraun Whaffe line (dark line in ribbon)
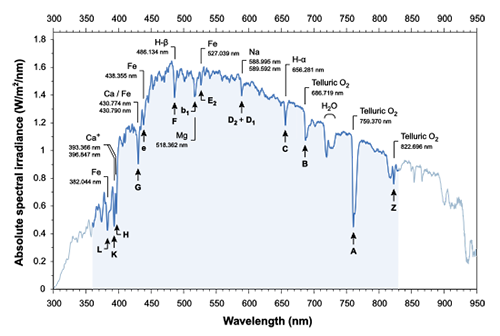
Fig. 6 Solar spectrum, with the concave portion corresponding to the Fraun Wolfel line
In the middle of the 19th century, The German physicists Kirchhoff and Bunsen, worked together at the University of Heidelberg, and with Bunsen’s newly designed flame tool (the Bunsen burner) and performed the first spectral analysis by noting the specific spectral lines of different chemicals (salts) sprinkled into Bunsen burner flame fig. 7. They realized the qualitative examination of elements by observing the spectra, and in 1860 published the discovery of the spectra of eight elements, and determined the existence of these elements in several natural compound. Their findings led to creation of an important branch of spectroscopy analytical chemistry: spectroscopic analysis
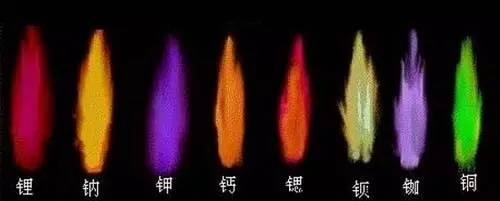
Fig.7 Flame reaction
In the 20s of the 20th century, Indian physicist C.V. Raman used a spectrometer to discover the inelastic scattering effect of light and molecules in organic solutions. He observed that the incident light scattered with higher and lower energy after interacting with light, which is later called Raman scattering fig 8. The change of light energy characterizes the microstructure of molecules, so Raman scattering spectroscopy is widely used in materials, medicine, chemical and other industries to identify and analyze the molecular type and structure of substances.
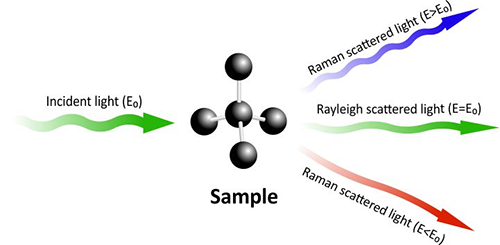
Fig. 8 The energy shifts after light interacts with the molecules
In the 30s of the 20th century, the American scientist Dr. Beckman first proposed to measure the absorption of ultraviolet spectra at each wavelength separately to map out the complete absorption spectrum, thereby revealing the type and concentration of chemicals in solution. This transmission absorption light route consists of the light source, spectrometer, and sample. The most of the current solution composition and concentration detection is based on this transmission absorption spectrum. Here, the light source is split onto the sample and the prism or grating is scanned to obtain different wavelengths Fig. 9.
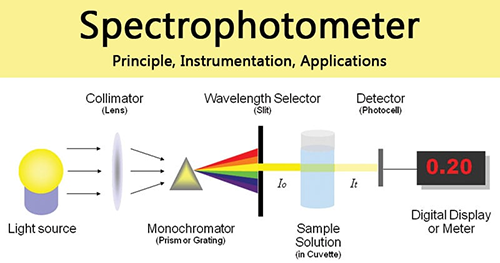
Fig.9 Absorbance Detection Principle –
In the 40s of the 20th century, the first direct detection spectrometer was invented, and for the first time, photomultiplier tubes PMTs and electronic devices replaced the traditional human eye observation or photographic film, which could directly read out the spectral intensity against wavelength Fig. 10. Thus, the spectrometer as a scientific instrument has been significantly improved in terms of ease of use, quantitative measurement, and sensitivity over the period of time.
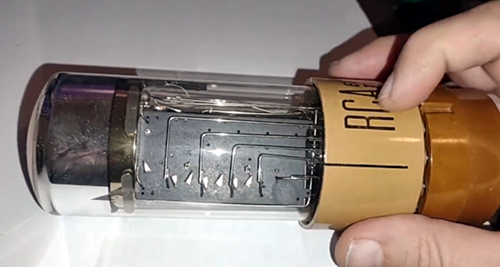
Fig. 10 Photomultiplier tube
In the mid-to-late 20th century, the development of spectrometer technology was inseparable from the development of optoelectronic semiconductor materials and devices. In 1969, Willard Boyle and George Smith of Bell Labs invented CCD (Charge-Coupled Device), which was then improved and developed into imaging applications by Michael F. Tompsett in the 1970s. Willard Boyle (left), George Smith won who won the Nobel Prize for their invention of the CCD (2009) shown Fig. 11. In 1980, Nobukazu Teranishi of NEC in Japan invented a fixed photodiode, which greatly improved the image noise ratio and resolution. Later, in 1995, NASA's Eric Fossum invented the CMOS (Complementary Metal-Oxide Semiconductor) image sensor, which consumes 100 times less power than similar CCD image sensors and has a much lower production cost.
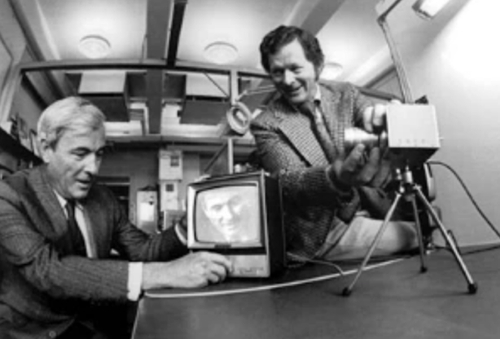
Fig. 11 Willard Boyle (left), George Smith and their CCD (1974)
At the end of the 20th century, the ongoing improvement of semiconductor optoelectronic chip processing and manufacturing technology, especially with the application of array CCD and CMOS in spectrometers Fig. 12, it becomes possible to obtain a full range of spectra under a single exposure. Over time, spectrometers have found extensive use in a wide range of applications, including but not limited to color detection/measurement, laser wavelength analysis, and fluorescence spectroscopy, LED sorting, imaging and lighting sensing equipment, fluorescence spectroscopy, Raman spectroscopy, and more.
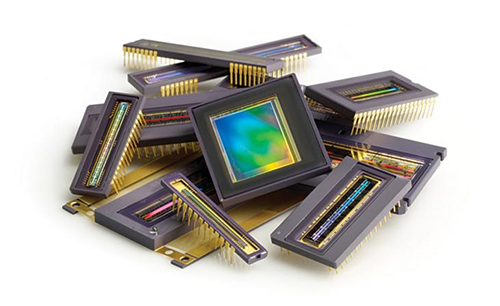
Fig. 12 Various CCD chips
In the 21st century, the design and manufacturing technology of various types of spectrometers has gradually matured and stabilized. With the growing demand for spectrometers in across all walks of life, the development of spectrometers has become more rapid and industry-specific. In addition to the conventional optical parameter indicators, different industries have customized requirement of volume size, software functions, communication interfaces, response speed, stability, and even costs of spectrometers, making the spectrometer development become more diversified.
Post time: Nov-28-2023